opening

Regular reports of my grabber activity and that of others, plus information on QRSS software, hardware and technique that comes my way

Sunday, September 29, 2013

An Automatic A/B Antenna Switch


A while back I did some tests with VK1OD to compare antennas using an automatic antenna switch he had devised for antenna testing.

I made a version of Owen's antenna switch which can be controlled by the QRS keying program  which I use to key my mept via the computer's serial line.  In the experiment described in this post it is being used to switch in an attenuator so I can transmit different power levels on the Mark and Space of the QRSS FSK signal.

Here's the schematic,


The driver transistor is located in my mept box and connected to the A/B switch box by a twisted pair.  DTR is the DTR line of the serial cable coming from the computer.  My mept is also keyed from this connection via another driver transistor

Here's a picture of the resulting keyer:


The attenuator is an L design with 50 Ohms to ground and a series resistor of 100 Ohms between A and B to give an attenuation of 10 dB.  You can see where I tack-soldered in parallel resistors to reach 10 dB as measured using Spectrum Lab.  The twisted pair on the left is the keying line from the serial port and there is an LED to indicate when antenna port B is switched in.

When used with the QRS keying program the switch automatically reduces the 1 W signal to 100 mW so one is on the Mark and the other on the Space.

The other use for this switch will be to compare antennas, my next project.

I have found the 10 dB comparison most illuminating.  I seldom run my mept but when I do I generally use   1 W because I'm interested in observing propagation and want to ensure results.  But, I often wonder what my signal would have looked like at the typical QRSS power level of 100 mW.  Now I know.  More often than not the 100 mW level is in the noise compared to the 1 W and would have required image stacking to identify the call.  It's not just a matter of power because of other factors such as the grabber's antenna and local noise and how the waterfall display is set up.

Here's an example taken from PA2OHH's grabber.  In the first image which is a single grab the 100 mW Space is barely discernible and not clear enough to ID the call which is clearly seen in the Mark:


Here's a stacked image of multiple grabs from the same grabber:


Now you can see the 100 mW Space quite clearly and read the call in un-cw.  I use this technique often on 40m where the 'barefoot' mepts don't make it out of the noise well enough to be identified.

It's no surprise that a 10 dB power gain makes a big difference but if you can read the lower power level then the gain is not very impressive.  It's when the lower power is not visible at all and them emerges from the noise to be readable at the higher level that the difference is most impressive.

de w4hbk


Tuesday, September 24, 2013

A Comparison of QRSS and WSPR for Measurement of Signal Strengths

This post describes measurements I made with the help of Keith, G6NHU, to compare Signal-to-Noise measurements displayed by WSPR with those I make using QRSS using the Spectrum Lab spectrogram technique described in a previous post

The versatile Ultimate 2 from QRP Labs has the capability of transmitting both QRSS and WSPR and can do so in the same message frame.  G6NHU has been doing this with his U2 for some time now by designing a message that sends QRSS for 8 minutes followed by a 2 minute WSPR frame, making it possible to monitor both modes on a routine basis.  Here's what it looks like on 20m:

Figure 1.  G6NHU QRSS/WSPR message


Keith usually transmits WSPR on the WSPR frequencies but for the purpose of this experiment it was on the same frequency as the QRSS otherwise it could easily disappear in the crowded WSPR band.  Note also that the WSPR message has the same bandwidth as the 5 Hz FSK so doesn't cause problems to other QRSS stations.

For our tests I ran the WSPR program and recorded G6NHU while simultaneously making grabs of the QRSS part with this screen:

Figure 2.  QRSS Screen Used to Measure SNR

The QRSS measurement is based on the SL "long term average" function which in this case is the 2 minute period at the end of the QRSS message shown in Figure 2.   The WSPR measurement immediately followed the 2 minute-averaged grab.  Refer to he link give above for more details.

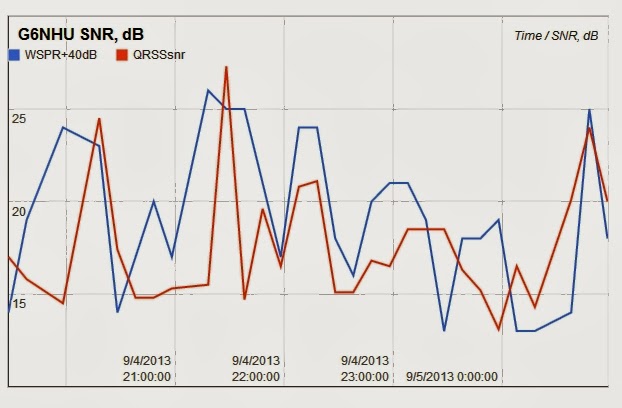
Over the time frame from 1900z to 0100z on 20m I recorded about 30 instances where G6NHU appeared on WSPR and had a clean grab on the Pensacola Snapper near the same time.  Not having much to do an a very rainy day I read all the QRSS captures and made a spreadsheet of QRSS/WSPR SNR determinations. From this I plotted the SNR's measured via QRSS and WSPR:

Figure 4.  Plot of SNR's Determined by QRSS and WSPR

The big difference in scale is caused by the bandwidths used in WSPR and QRSS.  WSPR relates the SNR to a BW of 2500 Hz while my Spectrum Lab settings are for a noise BW of 0.25 Hz. SNR is inversely proportional to BW because noise power varies with BW.  Therefore the change in SNR expressed in dB is,

delta(SNR)  = 10log((S1/N1)/(S2/N2)) = 10log(BW2/BW1), dB

     note that S1=S2 since the signal is monochromatic and does not change with BW

Thus the change in SNR for 2500 Hz and 0.25 Hz bandwidth's is:

         10log(2500/0.25) = 40 dB

which is added to the WSPR data in Figure 3 to obtain that inFigure 4.

Figure 4.  Correction for Bandwidth Differences

One thing in favor of the QRSS method is that it's possible to actually view the QRN/QRM situation at each determination of SNR...see Figure 2.  Compare this to the busy WSPR spectrum in Figure 1 where interference seems to be a distinct possibility.  As described above, the QRSS and WSPR measurements are 2 minutes apart which may account for some of the differences in agreement.

The large fluctuations in measured SNR are due mainly to QSB and not system noise.

de w4hbk