opening

Regular reports of my grabber activity and that of others, plus information on QRSS software, hardware and technique that comes my way

Friday, March 18, 2011

Temperature Controllers for QRSS Part 3

Here is info on another temperature controller used by PA0TAB which uses discreet components mounted at the crystal.  I'll quote the email:

"Hi Bill
I use another oven. Very simple. article Elektron 1976-6
See attachments. The picture is one of my versions
I feed from 12V stab and at the picture a 2N2905 is the PNP
I used 2 composite carbon resistors (Allen Bradley)
because they have flat surface. I use tin plate as mounting.
I soldered the Xtal, the 2905  and one contact of the NTC direct to the tin plate.
So they have a good thermal contact.
For 12v you have to increase the feeding resistor to the NTC thermistor.

I have also a version with one heating resistor of 4w 82 ohm ceramic
and a BD136 PNP (TO126 housing) also soldered
I use a styrophor isolation

I uxe an electronic thermometer and a mA meter to adjust.
Then I relace the potmeter by a fixed resistor
Temperature is adjustable about 90 til 130 degr F I use 110 degr.F.
I measure the temp amd the current. When the current goes down and the temp is to low decrease the potmeter til you have the right temperature.
Wait half an hour and check temp. If it is ok you could replace the potmeter by an equal resistor."

73 Johan pa0tab

Temperature Controller Used at PA0TAB

I recognize the two transistors as a Darlington pair and that makes me think of the op amp circuit I use (Part 1) but without the op amp...and why not.

Thanks for sharing, Johan.

de w4hbk

Thursday, March 17, 2011

Temperature Controllers for QRSS Part 2

Here is another temperature controller I've been trying out on my QRP Labs 80m MEPT.  It consists of just 4 components which are all mounted on the crystal.  Considering the small size of the crystals in the QL rigs this is quite an achievement.

 Figure 1.  Simple Temperature Controller


I found this circuit at a site devoted to Barometers, of all things.  You may well ask what is a TL431?  It is a programmable Zener diode.  Whatever voltage you place from the cathode to the connection coming out of the side will make it a Zener of that voltage.  It covers a range of 2.5 to 36 V.  The point where it starts to work, 2.5 V, is what we take advantage of to use it in a temperature controller.  Simply choose resistor values along the left side to make 2.5 V at the control electrode and it will switch on as the temperature drops below the set point and off as it goes above.  NTC thermistors are produced to a standard calibration curve and this is it for the NTC103 Thermistor:

Figure 2.  Calibration Curve for NTC103 Thermistors


On the above schematic the values not in ( ) are those of the original article and those in ( ) are the ones I selected based on a 9 V source and an operating temperature of 120 deg F/48.5 dec C.  From the curve in Figure 2 the resistance of the thermistor at 48.5 C is 3846 Ohms from which I calculated the other resistance to be 10k.

I installed these components on the short crystal in the new QRP Labs 80 kit which I was soldering up at the time.  Note that only two leads are required for the 9 V source and can be taken off a convenient location on the QL board.   Figures 3 and 4 shows what this looks like and Figure 5 shows the crystal assembly installed in the QRP 80.  I placed a 1 cm thick slab of Styrofoam between the crystal and circuit board as part of the thermal insulation.  To complete the insulation I whittled out a matching block of Styrofoam to place over the top.  When soldering up the QRP 80 it helps to move aside some of the components surrounding the crystal to accommodate the Styrofoam insulation.

Figure 4.  Connection of Components


It seems to work as well as the controller I described in Part 1.  When switched on the frequency quickly drops to a steady value and remains there for hours on end.  The big advantage is that no external circuitry is needed.  This is the way I plan to go when I build future MEPT's.

Before closing this post I'll mention yet a third temperature controller which is used by Johan, PA0TAB.  It consists of discreet components, two transistors and four resistors, which can be mounted on or at the crystal.  I'll describe that in a future post.

de w4hbk


Tuesday, March 15, 2011

Ionospheric Hiccup

When I was browsing my overnight grabs this morning I saw a glitch that at first appeared to be a problem with my temperature controller...everybody changed frequency at the same time.  But on closer inspection it looks like the glitch lies not with my controller but with the Ionosphere itself.  The first image is a 5 hour grab and the second a 10 minute grab of the glitch in question.  Upon careful examination you can see that the original Mark and Space frequencies are still there, somewhat obscured by the shifted signal.  The third image shows this in more detail.  Sometimes WSPR signals can superimpose strange patterns on our QRSS signals as can AGC pumping but their pattern is not at all like this.


It affected stations over a wide area of the Eastern US.  The initial glitch lasted just over one minute and resulted in a diminution of signal strengths for about 5 minutes after which they returned to about the levels preceeding the disturbance.  The upward shift in frequency indicates the disturbed region was moving towards me.

So, what the heck could influence the ionosphere over such a large area at the same time?  Only possibility that comes to mind is a large meteor event of the fireball category but the American Meteor Society website has no report of such an occurence today.  One does read about ionospheric blobs which appear spontaneously and move at high speeds, often in association with Sporatic E.  Maybe with the SE season upon us more such glitches will occur.

At least I've documented my observation here and will be on the lookout for future events of this nature.  It's easy to overlook the little things but they often are the most interesting.

de w4hbk

Monday, March 14, 2011

Temperature Controllers for QRSS Part 1


The crystal oscillators used in our MEPTs tend to drift with temperature by about a Hz for each degree of temperature.  Generally this is not a problem and does not limit the fun to be had with QRSS but for more advanced work control of frequency to within a Hz is desirable.

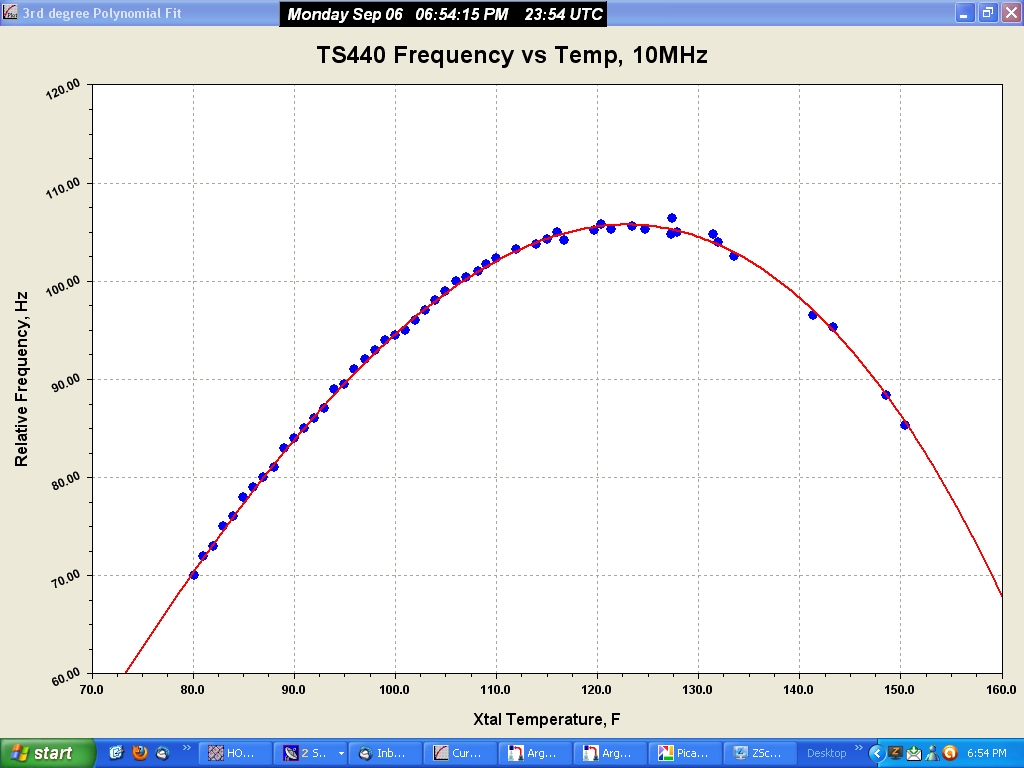
To get some idea of what the problem is like, I made measurements of the effect of temperature on both my MEPT and my rx, a TS-440.    The first figure is a plot of data I acquired for the 10140 kHz crystal in my homebrew MEPT.  Notice several things.  First, the linear region on the left is typical of room temperature from which we can deduce a rate of 1.4 Hz/degF or 2.4 Hz/degC.  Second, there is an inflection point labeled "Turnaround Point" where the frequency changes very little with temperature...this is the optimum operating temperature of a crystal.   The curve for the rx is oposite that of the tx because the rx involves a hetrodyning process.  I think these numbers are typical of all our QRSS crystals since they are of the AT cut because they are the cheapest and most affordable.
 
                                                                    
Figure 1.  Frequency change with temperature for 10140 kHz crystal

  Figure 2.  Frequency Change with Temperature for my TS-440                    


Now, let's look at some methods of controlling temperature.  When I built my first MEPT I copied most of my circuitry from 
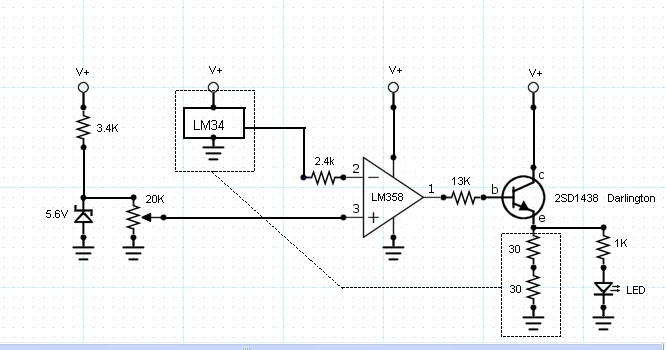
WA5DJJ who has done an excellent job of documenting his work.  I also used his temperature control circuitry but modified it a bit to fit the components in my junk box.  The most significant change was the use of an LM-34 temperature sensor which reads out directly in degrees F at the rate of 10mV per degree.  Use the LM-35 for Celsius.  The schematic of my controller is shown in Figure 3.

   Figure 3.  Temperature Controller Circuit Used at W4HBK                                                                                                                     

The LM-34 and 30 Ohm heating resistors are mounted on the crystal with good thermal contact and the other components at a convenient location elsewhere.  The way it works is that the OpAmp compares a known voltage from the Zener-potentiometer combination (Set Point) with that measured by the LM-34 and switches on the heater resistors until a balance is obtained thus holding the temperature at the SP.  Other OpAmps can be used but you may need a feedback resistor from the output back to the  non-inverting input (+).  I've use both the LM-358 and TL082 but  found the LM-741 difficult to work with.

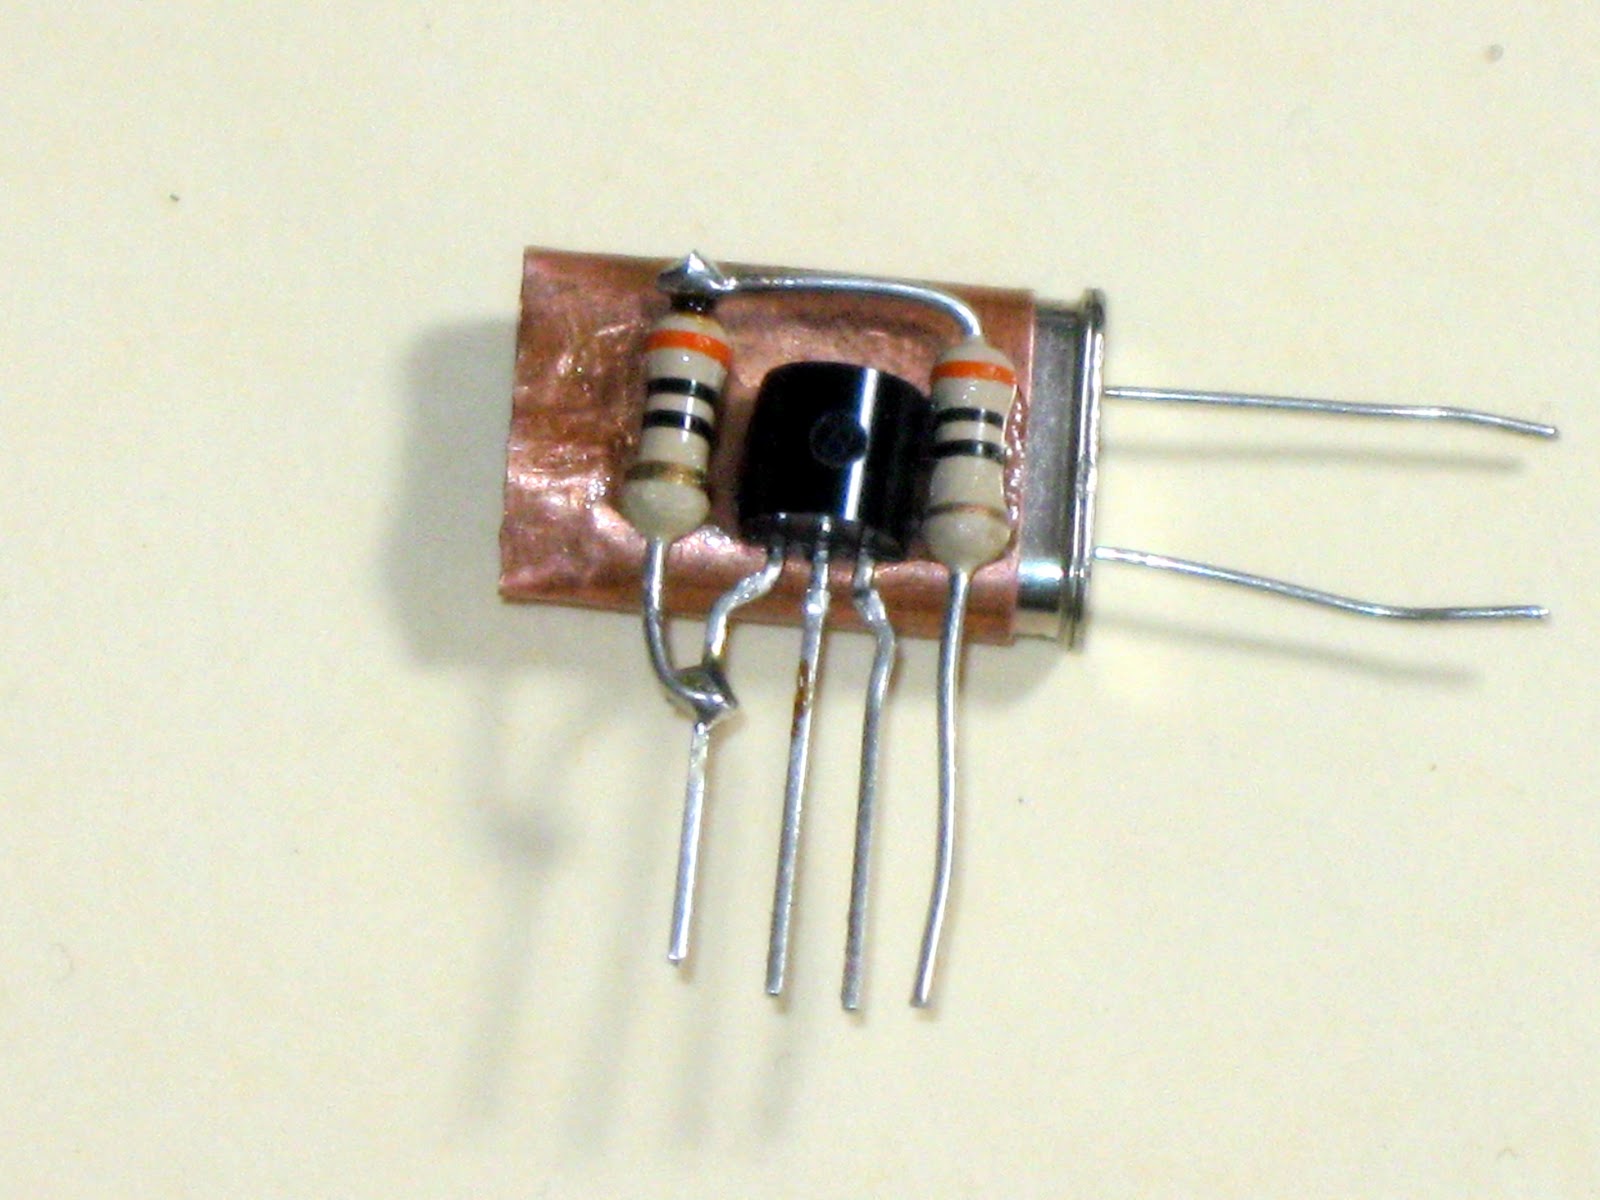
The next step was to make a sleeve out of copper foil that would fit snugly around the crystal, as shown in Figure 4.  When soldering the sleeve closed be careful not to let solder flow under the seam an to the crystal.  This will help distribute the heat and allow retrofit to an existing crystal, which is what I did later when adding temperature control to my TS-440.  Four wires are required to connect to the control circuitry and should be as small as feasible so as not to conduct heat away from the crystal.  Figure 5 shows how I glued the LM-34 and heater resistors to the copper sleeve using cyanoacrylate "SuperGlue".

         .Figure 4.  Copper Sleeve for Crystal                                           


   Figure 5.  LM-34 and Heater Resistors Glued to Copper Sleeve                               

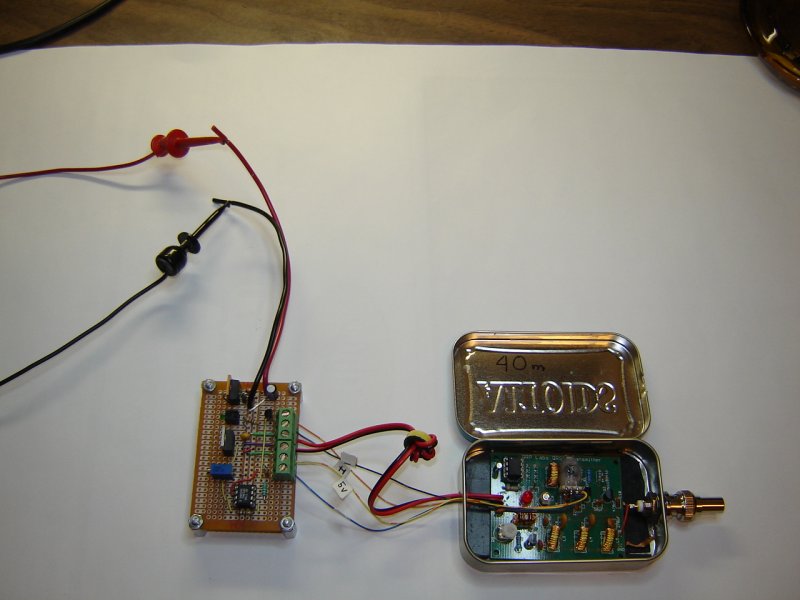
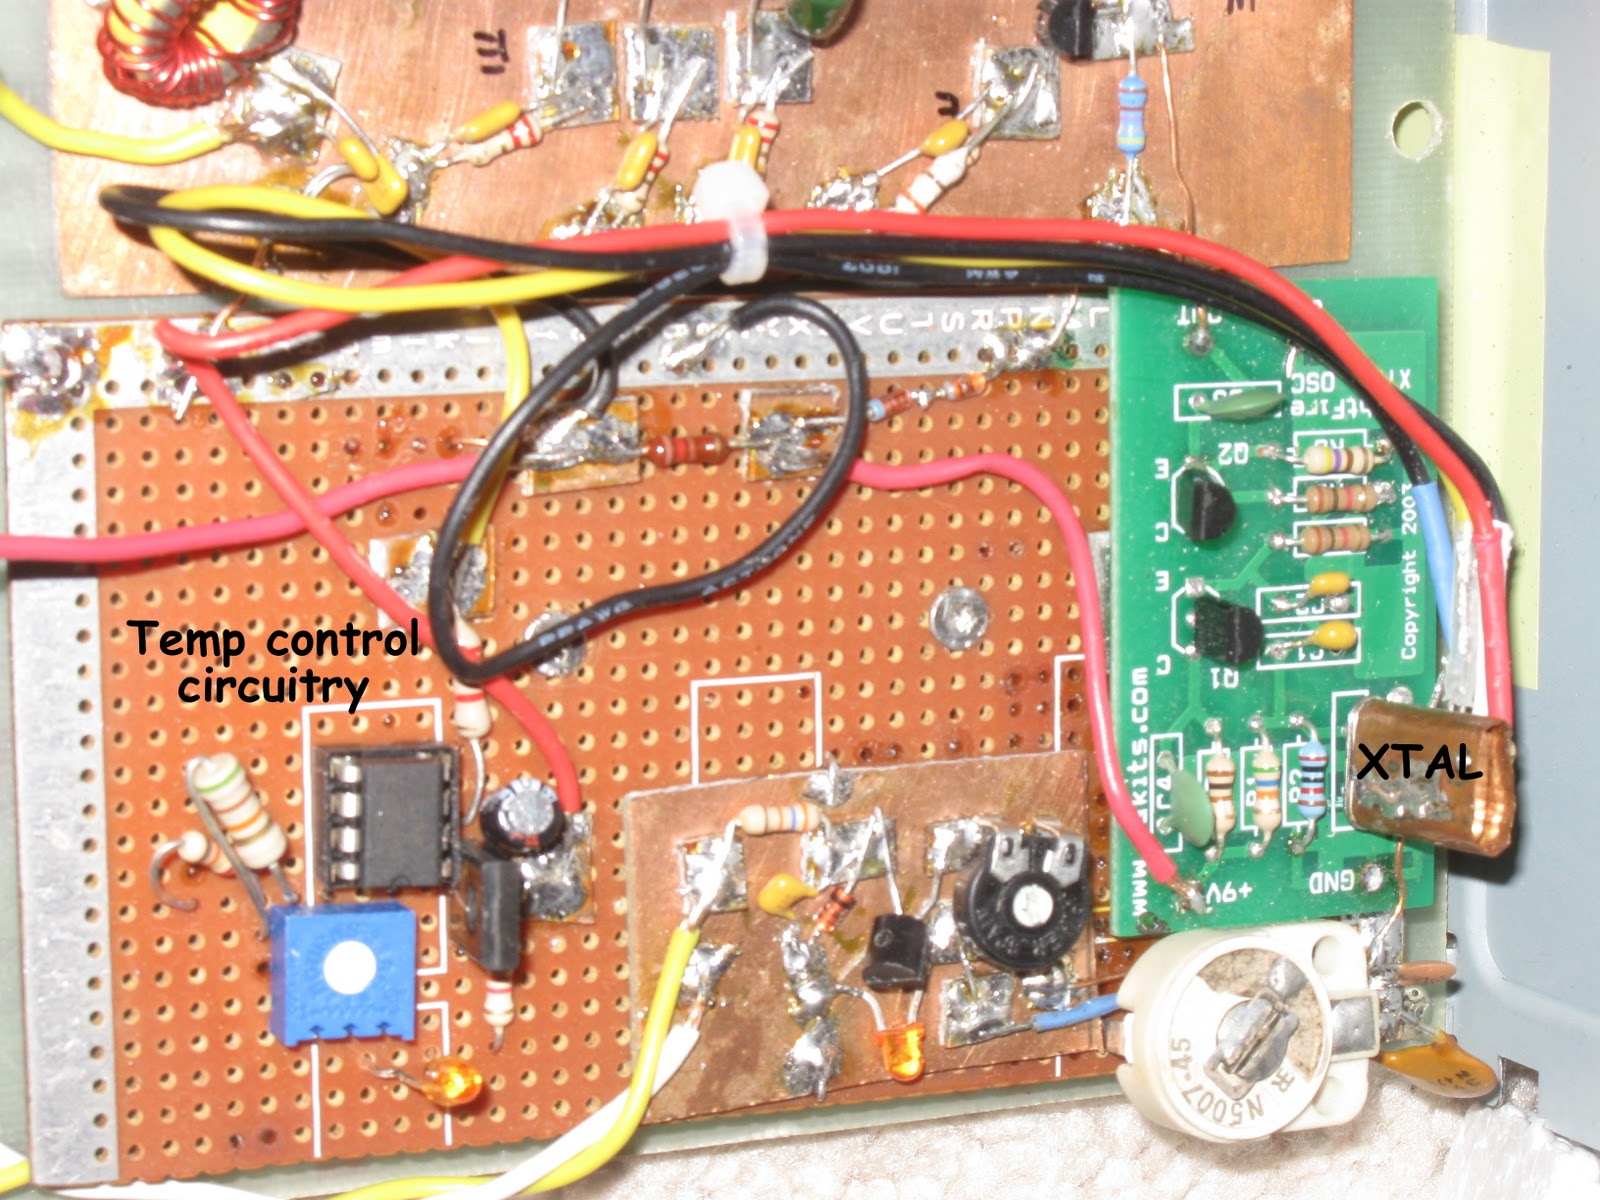
Figure 6 shows how it all comes together with the main components of the temperature controller located a short distance from the copper sleeve containing the LM-34 sensor and 30 Ohm heater resistors.  As a final touch I whittled out a small cube of Styrofoam to fit snugly around the crystal assembly to minimize heating requirements and provide some isolation from the other heat-generating parts of the rig.
   Figure 6.  My 30m MEPT showing how the crystal heater is connected to the control circuitry.         

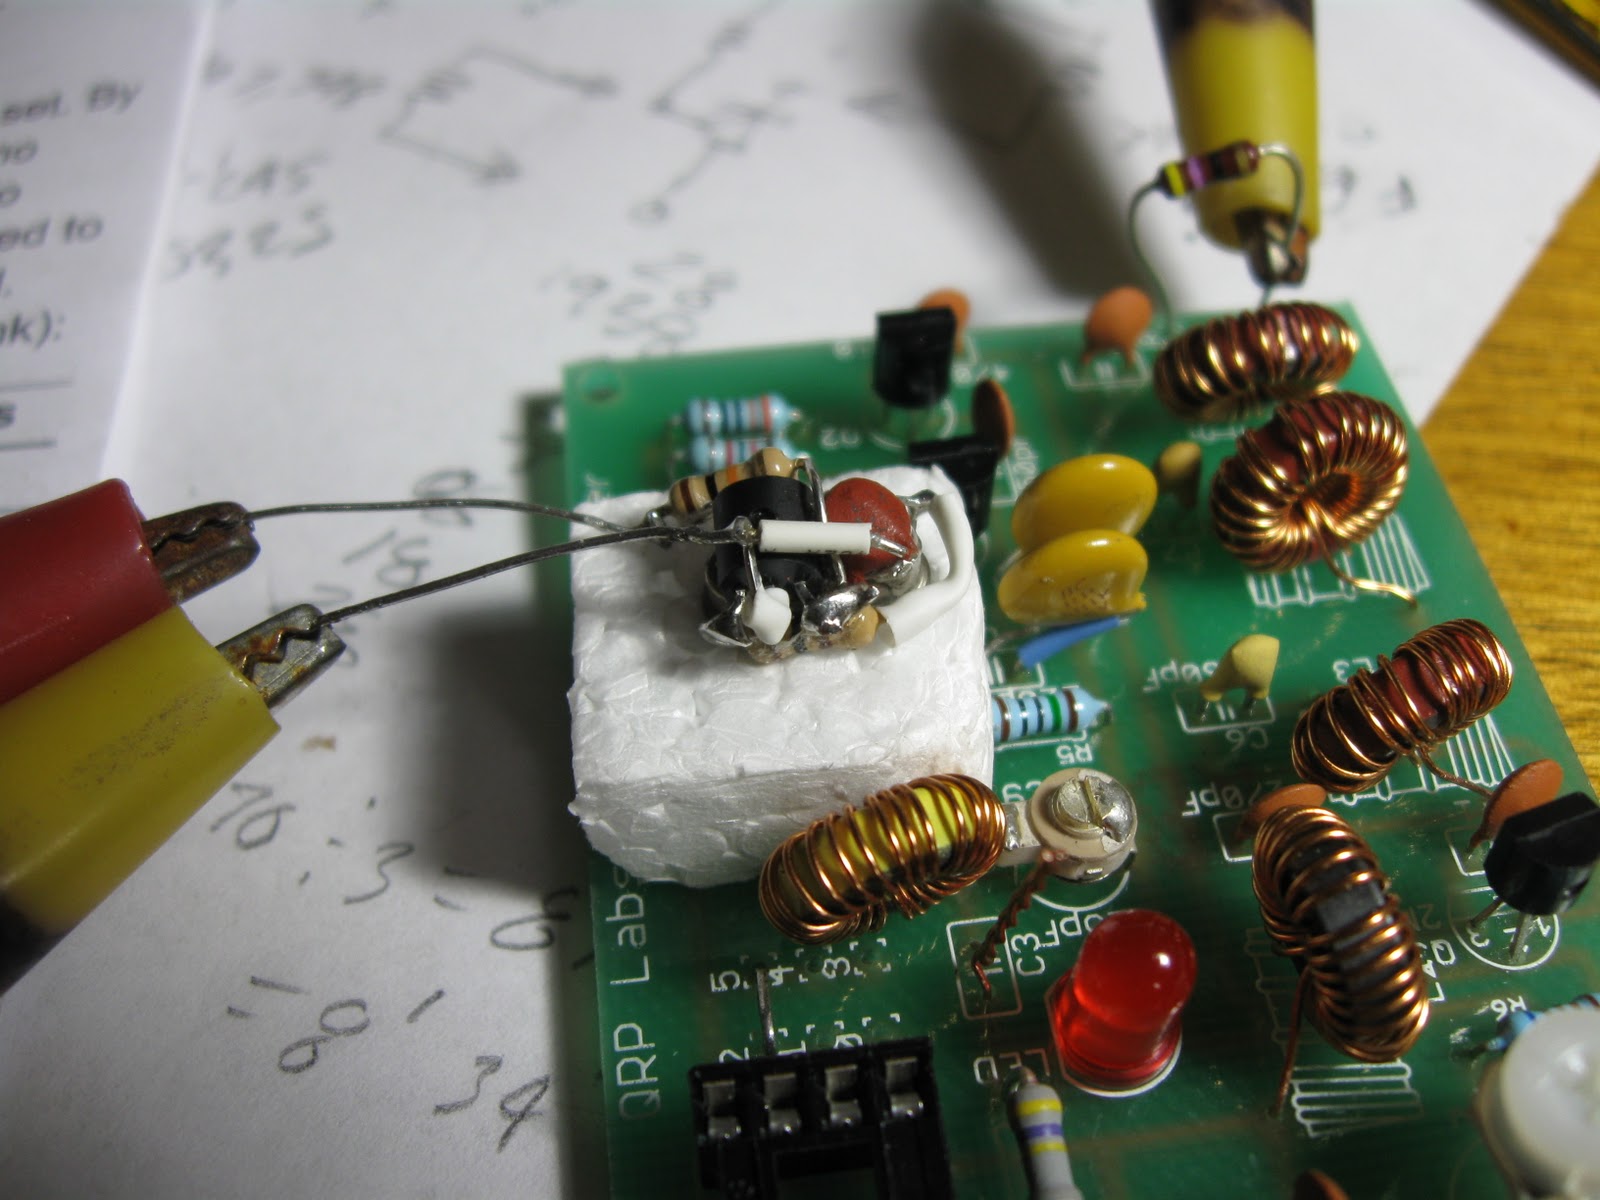
Mike, N0QBH emailed me asking for info about my temperature controller and I sent him much of the above data.  Figure 7 shows the really neat way he incorporated it in his QRP Labs MEPT .  Figure 8 is a close up of the crystal assembly.  Placing the components on the short crystals is more difficult that on the larger ones.  Note that there is a copper jacket around the little crystal.  There are more details at Mikes WebPage.

 Figure 6.  N0QBH's version of my temperature controller


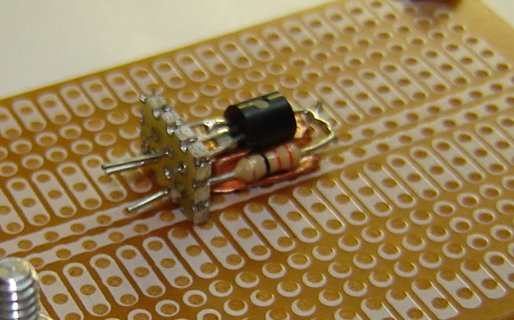
Figure 7.  Close up view of components mounted on crystal

I have recently tried a new temperature control circuit which has only 4 parts, ALL mounted on the crystal.  I use in on my 80m QRP Labs rig and so far it works about as well as the one I just described.  But I'm tired of typing tonight and will add a description of it to this post at a later time.  I will also tell you how I added a temperature controller to my TS-440.

de w4hbk


Wednesday, March 9, 2011

A new toy

I have experimented off and on with the "Watch Window" feature in Spectrum Lab which lets you plot a graph of signal intensity vs time.  Up to 10 signals can be view at once and plotted on the same graph in different colors.  Each signal is selected from the Waterfall Display by setting the lower and upper frequency.  For a square wave type QRSS signal this is just below and above the Mark and Space frequencies.

While I was doing this, Dave (WA5DJJ) was developing a way to compare antennas by having two stations transmit on the antennas using the same power level, 100mW in this case.  We had not been coordinating our efforts in any way but when I heard from Dave about his experiment  it occurred to me that the WW feature might allow us to view the relative signal strengths directly.  So, with both of the signals bracketed I began recording and here is my first image:

Figure 1 - Plot of Signal Strengths from WA5DJJ and KE5OFK


Both stations are located in the same neighborhood in Las Cruces, NM and I am 1164 mi/1873 km to the west.  OFK was using an inverted V,  DJJ a Butternut HF6V vertical and my receiving antenna was an inverted V broadside to them..

First thing I noticed is the slow QSB....then how the two stations fade 180 degrees out of phase. The inv V has the edge on peaks by several dB but much deeper fades.

                     Figure 2 - Same parameters as in Fig 1 but Nine hours later

The next image was taken about 9 hours later, near my sunrise.  Notice now that the two stations are now fading together and that the inv V is better than the vertical by about 7 dB.  I've seen this kind of signal strength differences on the Las Cruces stations before but could only judge which was stronger by the brightness of the traces.  Window Watch puts this into numbers though I haven't used it enough to have confidence I'm doing everything correctly....more testing and experimenting is needed.

Not only does this technique provide information about the antennas but also about the Ionosphere, but this is where things get really complicated because of all the phenomena which effect the amplitude and phase of a radio wave passing thru the Ionosphere.  With more observations and lots of reading maybe some of this will become apparent.  Your comments would be welcomed.  But for now I'm just showing some pretty pictures :>)

One final note....I cannot disable the AGC on my rx and I think this is why the Noise trace is fluctuating as strong signals cause pumping.  You can also see this on VK6JY's signal and it may be possible to correct for AGC effect by just subtracting off the noise level.

73 bill w4hbk