opening

Regular reports of my grabber activity and that of others, plus information on QRSS software, hardware and technique that comes my way

Monday, August 22, 2011

Measurement of 30m Noise Background at W4HBK

In my last post I described a method I use to disengage the AGC of my TS-440 so that accurate measurements of signal levels can be made.  Last Winter I tried to measure the background noise on my receiver but found that AGC compression was a major problem.  Now that I have that ironed out I've tried again to measure the background noise, this time with success.

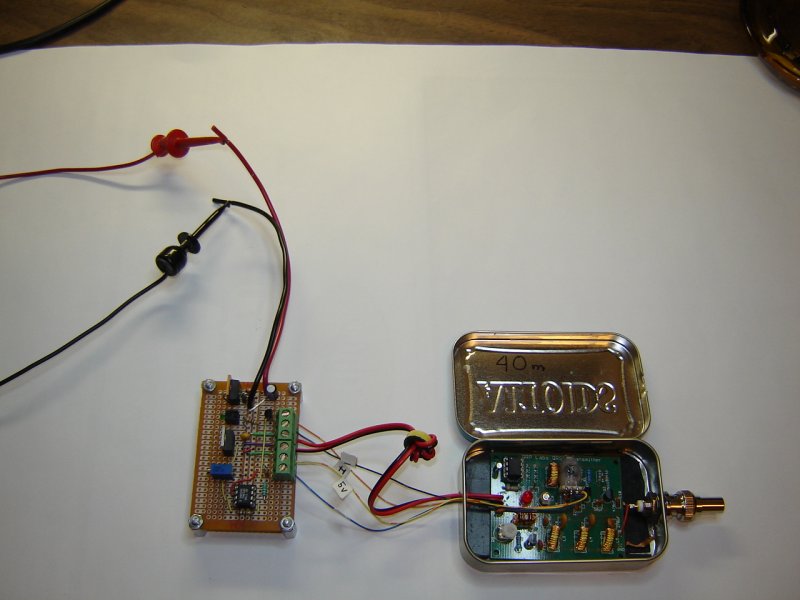
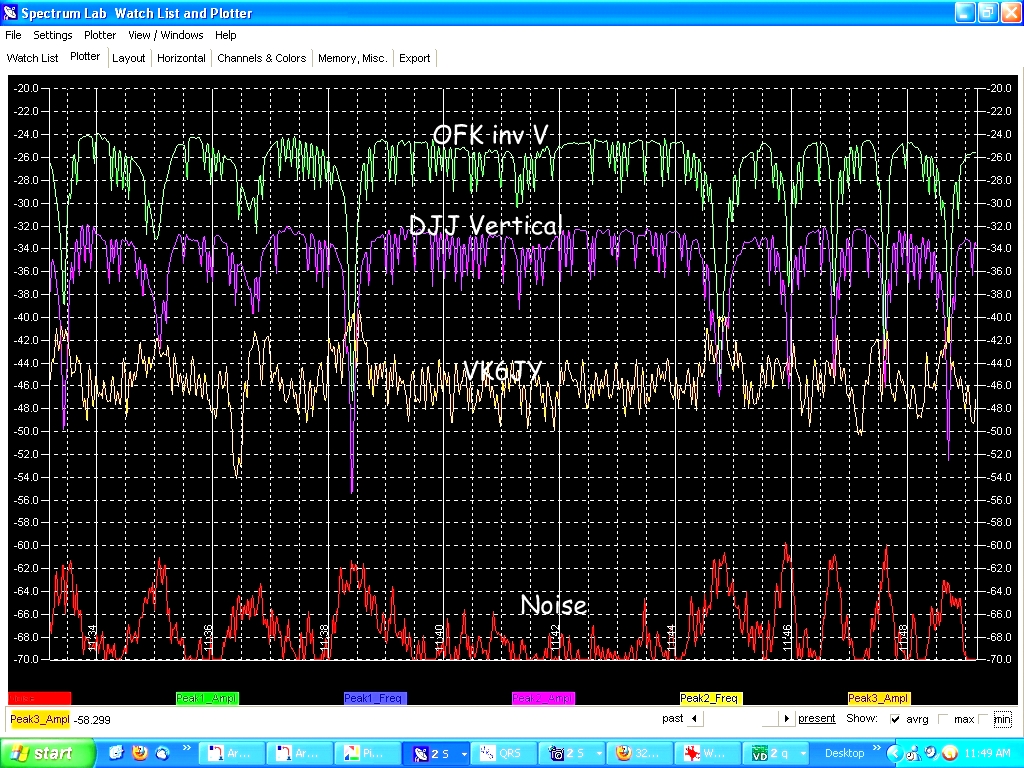
My system consists of an Inverted V antenna into a Kenwood TS-440 receiver whose audio output goes to a computer sound card and then the Spectrum Lab software.  All signal levels to which I refer are as measured on the SL display.  I define background noise as the signal level of the noise above the noise floor of my receiver which is determined by replacing the antenna with a 50 Ohm resistor.

I used a little know feature of Spectrum Lab called "Watch Window"   to record my data. WW allows you to select a specific part of the spectrum to be recorded as a strip chart, e.g., amplitude vs time.  I described this in a previous post called "New Toy" back in March.  Several expressions are available to measure both signals and noise.  The noise expression is,

     noise(freq1, freq2)

which measures the noise level between f1 and f2 and eliminates the effect of discreet signals using the following scheme:
   1.  an array of amplitudes from the last FFT calculation is sorted into order of increasing amplitude.
   2.  The amplitude of the lower quartile value is then returned as an estimate of the mean noise level. 

With the frequency range set to cover 10140.0 to 10140.1 and numerous QRSS signals present it ignores them and measures just the noise....like magic  You can read about this in more detail in the SL help file.  The only problem I've had is with strong RTTY and JT65 signals which cover the entire QRSS spectrum but this is rare and easily recognized..

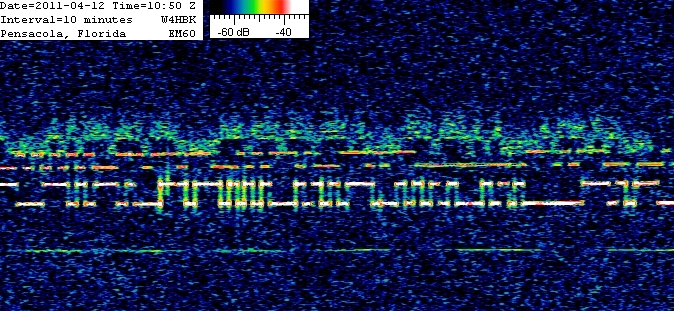
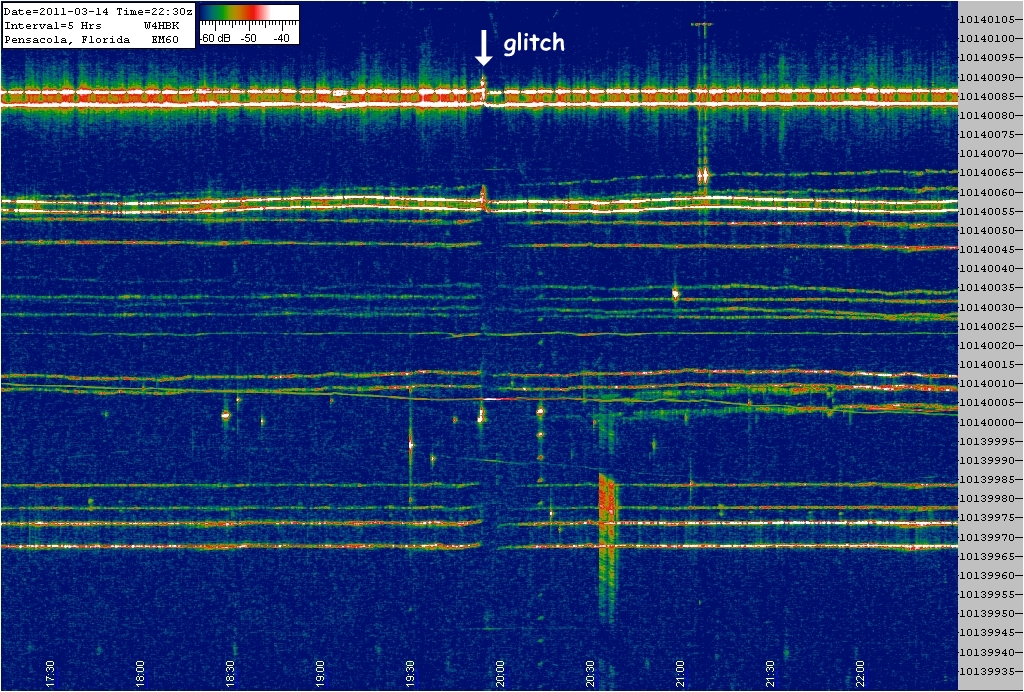
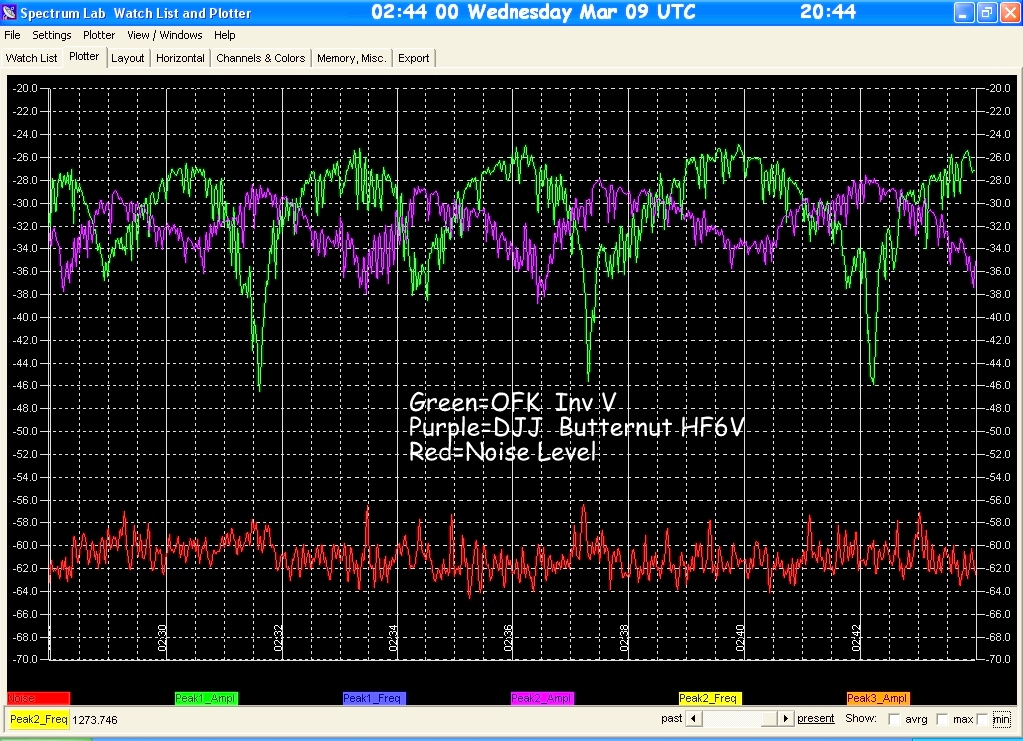
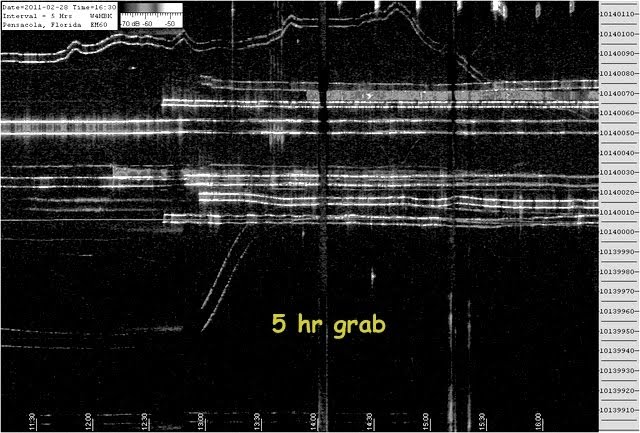
I recorded the noise background for a 24 hour period so see how it varied with time of day.  The results are shown in Figure 1.  The spikiness is due to static crashes plus occasional clicks and pops from electrical equipment.  I can hear nothing that sounds like power line noise or crt emission, etc....just the steady crunch of sferics.  Thunderstorm activity was actually mild during the measurement period with just a few small storms no closer than 25 miles, indicating to me that the sferics were propagating in from afar.

Figure 1.  Noise vs Time of Day Measured @ W4HBK
The time of maximum noise was just around sunset at about 35 to 40 dB above the NF.  Minimum noise occurred around noon at 20 to 25 dB above the NF.

For comparison I obtained the noise estimate from VOCAP, Figure 2.  The trend for time of day is close but I measured a max to min range about twice as large as VOCAP, 15 dB vs 7 dB, respectively.  My measurement is for a particular day whereas the VOCAP estimates are based on extensive observations used to determine averages.
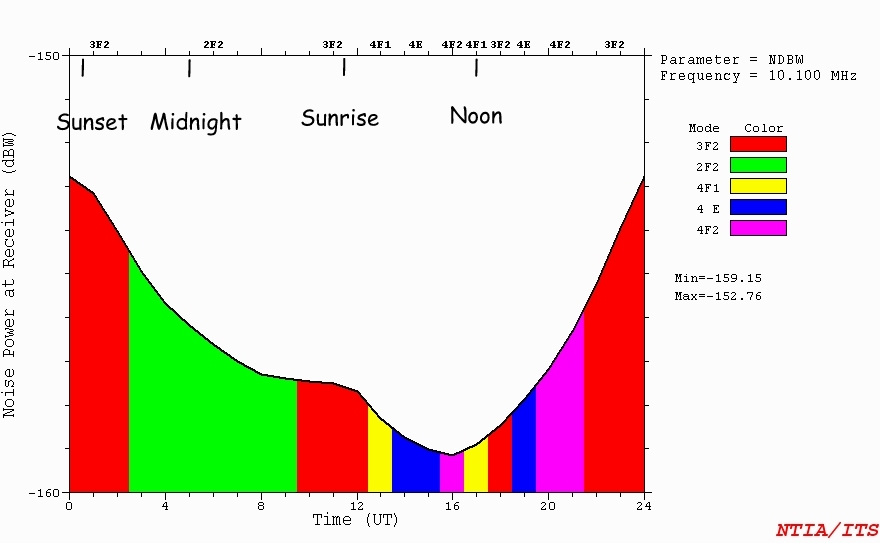
Figure2.  VOCAP Prediction of Noise @ Receiver
I plan to repeat the measurement several times to better characterize this time of year and then do the same for other seasons.  Can't wait for a cold Winter night to see how low we can go.


Tuesday, August 16, 2011

How to turn off your receiver's AGC

Even though the AGC is a wonderful invention there are times when it's nice to be able to turn it off.  In order to make quantitative measurements of signal levels the gain needs to be constant from the antenna input terminals to the audio output terminals.  The "A" in AGC keeps this from happening.

Very few receivers today have an "off" position for the AGC but I've found it is possible to effectively turn it off by simply backing off on the RF gain control.  I'm almost ashamed to say that in all my years hamming I have just discovered this.   Here's how it works.

Figure 1 is the AGC response curve made at Clifton Laboratories for a commercial grade receiver .  With the RF gain full on there is region from the noise floor up to a point called the "AGC knee" where receiver gain is linear.  At the knee the AGC kicks in and maintains a more-or-less constant audio output for an ever increasing RF input.  But, as the RF gain is backed off the knee moves to the right so that the linear region covers a much wider range and that's the fact we take advantage of to defeat the AGC.  If the knee is chosen carefully then all the signals likely to be received will be in the linear region.  It is always possible that a really strong signal will appear inside the bandpass to activate the AGC but for QRSS band conditions this is very unlikely.
Figure 1.  Receiver AGC Response Curve

As the RF gain on my TS-440 is reduced the S-meter moves up from the "peg" at S0 to higher and higher values...the higher it goes the wider the linear range.  I have found that S9 is a good set point.  To compensate for the drop in audio output I increase the audio gain.  Now you might think that in doing this that the SNR is being degraded but that's not the case.  While doing these experiments I keep track of the noise floor as well as the signal and the difference remains the same.  There is eventually a point where the signal is too weak to stay above the noise floor but for my system this is substantially above the S9 set point.

Not all receivers have the same AGC response curve and the linear region may not actually be all that linear.  To check my TS-440 I inserted attenuators of known values at the antenna terminals and looked for the corresponding drop in output as read via Spectrum Lab.  Actually I have only one attenuator I consider calibrated, a Tektronix 011-0059-01 fixed 20 dB type with BNC connectors.  I used this to check the internal attenuator in my TS-440 which is supposed to be 20 dB and checked out within a dB.  Thus I have two accurate 20 dB steps of attenuation for a total of 40 dB.

Figure 2 is the test setup.  For a signal source I used my Palomar R-X Noise Bridge which provides a strong, stable signal for testing.  With the noise source OFF the output as read by SL defines the system noise floor.  With the noise source ON the output was adjusted for a convenient level above the noise floor.  Attenuators were added to vary the input and the output observed on SL.
Figure 2.  Test Setup

Figure 3 shows the effect of the attenuators for two cases.  The first is with the AGC turned off by reducing the RF gain and you can see that the output closely follows the input.   The second run was made with the AGC full on at maximum RF gain where you can see the output hardly follows the input, particularly for the first step.  I did this run for two noise levels corresponding to S4 and S1.  The weaker level came closer to following the attenuation as is suggested in Figure 1. You can see AGC curves for other receivers at the previously cited link to help understand what goes on around the AGC knee  My hypothesis that reducing the RF gain turns the AGC off seems to be valid and the response of my receiving system is nearly linear under these conditions .  Now I can measure signal strengths and compare them in a meaningful way.
Figure 3.  Effect of Attenuators With and Without AGC

The impetus for this study was a desire to measure background noise so I could compare Summer and Winter conditions on the various bands for use with path loss calculations.  For example,  VOACAP predicts the signal level in dBm reaching a receiver from a transmitter for known power and antennas.  The unknown factor is the veiling effect of band noise.  I have begun making background noise measurements and can see the daily cycle and the effect of sferic spikes. This is interesting in and of itself and I'll describe it in a future post.

de w4hbk

Sunday, July 10, 2011

My New DDS MEPT

I haven't blogged lately because I've been working diligently on a new mept based around the DDS2 kit from N3ZI.  The DDS2 has been combined with a 5W amp from W8DIZ and a few other circuits to yield a QRSS mept which works from 160 thru 10 and can put out several Watts if needed.  I particularly want the extra power to use on 80 and 160 during the upcoming dx season.

Figure 1 shows the completed project which is mounted in a homebrew cabinet made from 1/4 inch (6mm) plywood.  The dimensions were chosen to fit in my wooden mini-rack which I built some years ago when I was into digital modes and had modems, controllers, etc to bring together.  The main components are:
 the DDS2 vfo,  a 20 dB preamp,  the W8DIZ 5W amp, a LED voltmeter and a lowpass filter assembly out of my original TS-440 which was killed by lightning in 1989.  The lpf filter selection is via a 12 V, 6-position switch and contains a forward/reflected power circuit which is easily read by the LED voltmeter.  The VM is based on a National LM3915 logarithmic display driver.
Figure 1.  Top View of Completed MEPT
The DDS2 was modified slightly by moving components to clear out a space around the crystal oscillator to anticipate styrofoam insulation for a temperature controller.  Also, the 7805 voltage regulator was moved off board to allow a thermal partition to isolate the heat sensitive components from the rest of the circuitry.  There are two external inputs for the DDS2, a RS232 line for programming and a keying line for fsk via the program QRS.  I am a real fan of QRS because it allows user-defined messages, has dfcw capability and has precise timing for image stacking work. The circuit recommended in the QRS help file was used to convert rs232 voltages to the open/short needed for fsk. 

The DDS2 output is about 0.25 V peak-to-peak into 200 Ohms (40 uW) and some amplification is necessary to drive the DIZ amp.  I used the simple circuit suggested by N3ZI which gives about 20 dB of gain which is more than adequate.

I added cooling fins to the final transistors of the DIZ amp, consisting of several square inches of 40 gauge copper sheet.  They get fairly warm when running 2W but I don't intend to operate above this level since the amp is intended for intermittent use.  Power level can be adjusted by a potentiometer which I moved from the board to the front of the cabinet for convenience.

The Low Pass Filter is a board from a TS-440 and has a six wire cable for switching the individual LPFs via a 6-position switch.  It also has circuitry for reading forward and reflected power.  This was certainly a boon to the project and I'm so glad I hung onto it over the years.  If you want to make you own LPF Dave, WA5DJJ,  shows you how at his web site.  His covers 160-10 and uses dip switches to select the individual filters.

One last item is a logarithmic voltmeter circuit complete with LEDs for measuring the fwd/ref power from the LPF board.  It's on a .75 x 2.5 inch board which I mounted directly on the front panel along with a spdt switch to select forward and reflected.

Figure 2 shows the front panel and mounting of controls and indicators.
Figure 2.  Front Panel and Rack Mounting
This is not intended to be a construction article but just an outline of how I assembled the parts.  If you want more detailed information send me an email.

What a pleasure it is to be able to move to any band and select a clear frequency.  The power control is way cool also, as is being able to see the power and check on reflected to make sure the antenna ain't misbehavin.  So far I haven't gotten around to adding temperature stabilization but with the thermal isolation provided by the wooden cabinet and the thermal partition it is stable enough for image stacking up to three or four hours.  My ultimate goal is to add an ocxo which should provide stability down to 0.01 Hz...such units are available on eBay for about $20.  Then again I might make my own.

You might have noticed the BNC at the lower left of the front panel.  This is an auxiliary vfo output which I want to use in rx experiments.

Finally, if you like the idea of measuring fwd/ref power  here is kit from W8DIZ  intended for QRP.  The LED display has been in my junk box for years so ur on ur own for this component.

de w4hbk

Tuesday, June 14, 2011

Improvements to my air conditioning system as observed on the ON5EX grabber

Several nights ago I had my mept on 40m and recorded it's reception on the ON5EX grabber using SiteShoter then stitched the grabs together to see how I did over the long term.  I have described this technique previously on this blog.  Here's what it looked like:
So, what's this got to do with my air conditioning?  When we first moved to this QTH the air condx would cycle on and off on a hot summer day but as the years went by it got to the point of running continuously 24/7 and our electricity bill rose accordingly.  Over the winter we had an energy audit courtesy of the local power company and the auditor recommended we have our ductwork checked for leaks and add more insulation in the attic.  We followed his advice and as the temps began to climb into the upper 90's (37 C) earlier this month it was a relief to note the air condx was once more cycling on and off.  I meant to make a few measurements but haven't had time so far....until the night I recorded the above data.

My mept at the time was a QRP Labs kit which I have found to drift with changes in room temperature and I can see that drift on the ON5EX grabber. It shows the air condx to come on for 10 minutes then off for 10 minutes.  The change in temperature is several degrees F based on a previous calibration also describe on this blog.

Consider the irony.  I have without intending to do so remotely sensed the performance of my air conditioning system via a facility located in Belgium.

de w4hbk

Tuesday, May 24, 2011

FollowUp on Using WSPR Data

A few hours ago I checked the 20m WSPR data for the EU to NJ path during the past 24 hrs.....what a difference from the past weekend!  See for yourself:

Figure 1.  EU stations heard @ K1JT on May 21


Figure 2.  EU stations heard @ K1JT on May 24

Apparently condx were terrible over the weekend while my grabber was on 20.  The only dx station I heard was G6AVK and just for a few hours around 2300z.  If we had been on the past 24 hours I should have heard EU longer and probably louder.

The reason I'm interested in all this is that I've been thinking of moving my grabber to one of the higher bands during my local daylight  (1300z to 2300z) since that is usually when the dx comes thru to Florida.  But not being one to beat a dead horse I want to have some assurance of success.  My plan is to keep and eye on WSPR data as a guide to which bands and times to be QRV, particularly as a supplement to standard propagation predictions.

de w4hbk

Monday, April 18, 2011

Temperature Control for My Kenwood TS-440

Here's how to add a temperature controller to an older rig like my Kenwood TS-440.  Essentially you just make a copper sleeve for the master crystal, glue on a pair of heating resistors, a LM-35 temperature sensor and use a 4-wire cable to connect to the control circuit located outside the rig.  This is the same approach I described previously in Part 1 of my series on temperature controllers.

The main requirement it that the frequency of the receiver be controlled by a single master crystal as in the TS-440.  Older radios with multiple crystals used for the various hetrodyning stages will be too awkward to adapt because a separate controller would be required for each one.*

The TS-440 is actually pretty challenging with respect to cramped quarters.  The crystal is located in the middle deck of a stack of 3 PC boards with very little room for the compact sleeve that fits around the xtal....but it just works.  Figure 1 shows what we're up against.


Figure 1.  Location of master crystal in the TS-440


The front of the rig is at the top of the photograph.  Note the upper deck has been swung up to allow access to the middle deck where the crystal is located.  The small chassis to the right contains he outboard temperature control circuitry.  The cable connecting the two is a 4-conductor type from an old modem line.

Figure 2.  Close-up of Copper Sleeve Installed on Crystal


Figure 2 is a closer view of the crystal location showing the copper sleeve installed.  The heating resistors are on the left and right sides of the sleeve and if you look carefully you can see the TO-92 case of the LM35 in between.  Note how close the crystal is to the shield of one of the PLL's...there is only a few mm spacing and no room for Styrofoam insulation as I have used with other TC's.

Figure 3.  Case Closed

Figure 3 shows the case closed back up.  Along the front of the controller are, L to R, temperature control pot, LED indicator, Temp or drive voltage switch and RCA plug for voltmeter.  Figure 4 shows everything set up and operating.  When power is first applied to the controller the LED glows brightly then gradually dims to a steady value to indicate regulation.

Figure 4.  System in Operation


How does it perform?  Bottom line, the frequency is stable enough for long duration stacking work up to 6 hours.  When I monitor WWV the variation over a day is +/- 1 Hz when the wx is nice enough to leave the windows open 24/7 and outdoor temperatures vary by 15 degrees F.  I adjusted the operating temperature to 125 deg F (52 C) which is the measured turn-around point for the TS-440 crystal.  I determined this by varying the temperature with the pot and noting the point where temperature quits decreasing and starts increasing again....see Part 1.  The ceiling fan has a noticeable effect on temperature variations and when I'm really serious about stacking I leave it on low speed to keep the air in the shack well stirred.

de w4hbk


Friday, April 15, 2011

WA5DJJ's new mept

Dave, WA5DJJ, has brought together some ideas to produce the ultimate QRP Labs mept modification that is stable in both time and frequency to make it adequate for image stacking.  To jog ur memories, it is possible to stack successive grabs using an astrophotography program called Rot'N'Stack to pull really weak signals out of the noise. To do so the message must appear at exactly the same place on the grab from one to the next, i.e., must be stable in both time and frequency. The SNR improves as the square root of the number of images stacked.  I'll leave it to Dave to describe his mods but basically it involves using the 4-component temperature controller I described in Part 2 of my series here on this blog and the change to a PIC keyer designed by Mike, N0QBH.  This latter mod allows a 32 kHz clock xtal to stabilize the timebase.

Last night I recorded the signal from Dave' new rig and the results were nothing short of phenomenal.  Over a period of 4 hours he drifted only 1 Hz, which as I told him could easily be my rx...the wx is wonderful now and we're leaving the windows open in the shack resulting large temperature changes.  The times base was virtually jitter free and started exactly on time every 10 minutes.  Figure 1 shows his signal as recorded on my 5 hr grabber. 

Figure 1.  5 hour grabber showing Dave's signal


Each of the short pulses represents a 10 minute grab as normally seen on my regular grabber.  I used 25 of the 10 minute grabs, going from 0717z to 1114z, in the Rot'n'Stack stacking program to produce the averaged image shown in Figure 2.  Even though Dave's signal was strong and didn't need stacking to bring it out of the noise, this provided an acid test of his rig's stability in both time and frequency.  The degree to which it is off will appear as blurring or jitter.  The timing is virtually perfect and what little frequency blur there is is caused by the 1 Hz drift over the recording time.

Figure 2.  Stacked average of 25 grabs


In addition to Dave's signal, several surprises popped out of the noise.  VK6JY is using a stabilized Hewlett-Packard signal generator which responded quite well to the stacking process.  There was no hint of N4FRE or ZL1EE even on the 5 hr grab which has a much better SNR than the 10 minute grabbs.  Both have highly stabilized signals via atomic clocks and/or GPS.  FRE usually drops completely out this time of night and if any of his signal was left it was completely obliterated by P29ZL.  It's ironic to be using sophisticated software and equipment to extract a 'local' station out from under one so far away (with an antenna  up in a banana tree no less).  However ZL's mept is not stabilized in time and thus averages at the same time FRE's builds up.  QRSS does have it's moments.

Congratulations to Dave on his new rig.  It looks like all the mods can be added directly to the rig so it will still fit in an Altoids tin.  Now if everybody adopts those mods then they too can pop out of the noise when stacking is applied.

de w4hbk

P29ZL


The signal of P29ZL caught my attention soon after it's appearance on my grabber last month for two reasons.  First, it appears almost every night for about 5 hours, very strong and easy to copy.  But equally interesting is the extreme multipath/Doppler effect which is always present for at least part of the time.  Tim's mept, from the WA5DJJ Labs,  runs 250 mW to an inverted V hung in a 25 foot banana tree.  Figure 1 is a 5 hour grab from a few nights ago and is typical of what I see every night:  note in particular the considerable fuzziness of the signal between 1000 to 1100z.  Figure 2 is from the 10 minute grabber and shows the effect in more detail.  Other signals from out that way, most notably VK6JY show just a bit of broadening but nothing like that from P29ZL.

Figure 1 - P29ZL on the W4HBK 5 hr grabber, 12Apr11, 30m 


Here is my understanding of the multipath/Doppler effect.  As the signal passes through the ionosphere it may be partially refracted back towards Earth but a part may continue on to find another refracting region for a second signal, an so on.  At the same time multiple hops can occur with the results that a number of signals can arrive at the receiving antenna.  But for a Doppler shift to occur these various regions must be moving relative to one another.  Without this relative motion the signals arriving from the various paths would be at the same frequency but differing in phase to cause fading due to interference.  Other phenomena such as ionospheric irregularities and turbulence can also contribute a continuous broadening....visualize an eddy where some of the electrons are moving towards and some away from the path of propagation.  I've noticed that most writers of the scholarly articles end up stating how complex is the ionosphere....as the kid next door says to me sometimes. "Well, Duhhh!"

Usually the M/D effect is relatively simple with just 2 noticeable frequencies and I see this almost every day on one signal or another as the band is changing around sunrise/sunset.  What makes the fuzz on P29ZL's signal unique is that it's a daily occurrence with a near-continuous broadening, usually towards a higher frequency which would indicate the path length is decreasing.  Sometimes one or two distinct frequencies appear out of the continuum.

Enough for now about this most interesting signal but I will be keeping an eye on things and doing a bit more reading.

de w4hbk

Friday, March 18, 2011

Temperature Controllers for QRSS Part 3

Here is info on another temperature controller used by PA0TAB which uses discreet components mounted at the crystal.  I'll quote the email:

"Hi Bill
I use another oven. Very simple. article Elektron 1976-6
See attachments. The picture is one of my versions
I feed from 12V stab and at the picture a 2N2905 is the PNP
I used 2 composite carbon resistors (Allen Bradley)
because they have flat surface. I use tin plate as mounting.
I soldered the Xtal, the 2905  and one contact of the NTC direct to the tin plate.
So they have a good thermal contact.
For 12v you have to increase the feeding resistor to the NTC thermistor.

I have also a version with one heating resistor of 4w 82 ohm ceramic
and a BD136 PNP (TO126 housing) also soldered
I use a styrophor isolation

I uxe an electronic thermometer and a mA meter to adjust.
Then I relace the potmeter by a fixed resistor
Temperature is adjustable about 90 til 130 degr F I use 110 degr.F.
I measure the temp amd the current. When the current goes down and the temp is to low decrease the potmeter til you have the right temperature.
Wait half an hour and check temp. If it is ok you could replace the potmeter by an equal resistor."

73 Johan pa0tab

Temperature Controller Used at PA0TAB

I recognize the two transistors as a Darlington pair and that makes me think of the op amp circuit I use (Part 1) but without the op amp...and why not.

Thanks for sharing, Johan.

de w4hbk

Thursday, March 17, 2011

Temperature Controllers for QRSS Part 2

Here is another temperature controller I've been trying out on my QRP Labs 80m MEPT.  It consists of just 4 components which are all mounted on the crystal.  Considering the small size of the crystals in the QL rigs this is quite an achievement.

 Figure 1.  Simple Temperature Controller


I found this circuit at a site devoted to Barometers, of all things.  You may well ask what is a TL431?  It is a programmable Zener diode.  Whatever voltage you place from the cathode to the connection coming out of the side will make it a Zener of that voltage.  It covers a range of 2.5 to 36 V.  The point where it starts to work, 2.5 V, is what we take advantage of to use it in a temperature controller.  Simply choose resistor values along the left side to make 2.5 V at the control electrode and it will switch on as the temperature drops below the set point and off as it goes above.  NTC thermistors are produced to a standard calibration curve and this is it for the NTC103 Thermistor:

Figure 2.  Calibration Curve for NTC103 Thermistors


On the above schematic the values not in ( ) are those of the original article and those in ( ) are the ones I selected based on a 9 V source and an operating temperature of 120 deg F/48.5 dec C.  From the curve in Figure 2 the resistance of the thermistor at 48.5 C is 3846 Ohms from which I calculated the other resistance to be 10k.

I installed these components on the short crystal in the new QRP Labs 80 kit which I was soldering up at the time.  Note that only two leads are required for the 9 V source and can be taken off a convenient location on the QL board.   Figures 3 and 4 shows what this looks like and Figure 5 shows the crystal assembly installed in the QRP 80.  I placed a 1 cm thick slab of Styrofoam between the crystal and circuit board as part of the thermal insulation.  To complete the insulation I whittled out a matching block of Styrofoam to place over the top.  When soldering up the QRP 80 it helps to move aside some of the components surrounding the crystal to accommodate the Styrofoam insulation.

Figure 4.  Connection of Components


It seems to work as well as the controller I described in Part 1.  When switched on the frequency quickly drops to a steady value and remains there for hours on end.  The big advantage is that no external circuitry is needed.  This is the way I plan to go when I build future MEPT's.

Before closing this post I'll mention yet a third temperature controller which is used by Johan, PA0TAB.  It consists of discreet components, two transistors and four resistors, which can be mounted on or at the crystal.  I'll describe that in a future post.

de w4hbk


Tuesday, March 15, 2011

Ionospheric Hiccup

When I was browsing my overnight grabs this morning I saw a glitch that at first appeared to be a problem with my temperature controller...everybody changed frequency at the same time.  But on closer inspection it looks like the glitch lies not with my controller but with the Ionosphere itself.  The first image is a 5 hour grab and the second a 10 minute grab of the glitch in question.  Upon careful examination you can see that the original Mark and Space frequencies are still there, somewhat obscured by the shifted signal.  The third image shows this in more detail.  Sometimes WSPR signals can superimpose strange patterns on our QRSS signals as can AGC pumping but their pattern is not at all like this.


It affected stations over a wide area of the Eastern US.  The initial glitch lasted just over one minute and resulted in a diminution of signal strengths for about 5 minutes after which they returned to about the levels preceeding the disturbance.  The upward shift in frequency indicates the disturbed region was moving towards me.

So, what the heck could influence the ionosphere over such a large area at the same time?  Only possibility that comes to mind is a large meteor event of the fireball category but the American Meteor Society website has no report of such an occurence today.  One does read about ionospheric blobs which appear spontaneously and move at high speeds, often in association with Sporatic E.  Maybe with the SE season upon us more such glitches will occur.

At least I've documented my observation here and will be on the lookout for future events of this nature.  It's easy to overlook the little things but they often are the most interesting.

de w4hbk

Monday, March 14, 2011

Temperature Controllers for QRSS Part 1


The crystal oscillators used in our MEPTs tend to drift with temperature by about a Hz for each degree of temperature.  Generally this is not a problem and does not limit the fun to be had with QRSS but for more advanced work control of frequency to within a Hz is desirable.

To get some idea of what the problem is like, I made measurements of the effect of temperature on both my MEPT and my rx, a TS-440.    The first figure is a plot of data I acquired for the 10140 kHz crystal in my homebrew MEPT.  Notice several things.  First, the linear region on the left is typical of room temperature from which we can deduce a rate of 1.4 Hz/degF or 2.4 Hz/degC.  Second, there is an inflection point labeled "Turnaround Point" where the frequency changes very little with temperature...this is the optimum operating temperature of a crystal.   The curve for the rx is oposite that of the tx because the rx involves a hetrodyning process.  I think these numbers are typical of all our QRSS crystals since they are of the AT cut because they are the cheapest and most affordable.
 
                                                                    
Figure 1.  Frequency change with temperature for 10140 kHz crystal

  Figure 2.  Frequency Change with Temperature for my TS-440                    


Now, let's look at some methods of controlling temperature.  When I built my first MEPT I copied most of my circuitry from WA5DJJ who has done an excellent job of documenting his work.  I also used his temperature control circuitry but modified it a bit to fit the components in my junk box.  The most significant change was the use of an LM-34 temperature sensor which reads out directly in degrees F at the rate of 10mV per degree.  Use the LM-35 for Celsius.  The schematic of my controller is shown in Figure 3.

   Figure 3.  Temperature Controller Circuit Used at W4HBK                                                                                                                     

The LM-34 and 30 Ohm heating resistors are mounted on the crystal with good thermal contact and the other components at a convenient location elsewhere.  The way it works is that the OpAmp compares a known voltage from the Zener-potentiometer combination (Set Point) with that measured by the LM-34 and switches on the heater resistors until a balance is obtained thus holding the temperature at the SP.  Other OpAmps can be used but you may need a feedback resistor from the output back to the  non-inverting input (+).  I've use both the LM-358 and TL082 but  found the LM-741 difficult to work with.

The next step was to make a sleeve out of copper foil that would fit snugly around the crystal, as shown in Figure 4.  When soldering the sleeve closed be careful not to let solder flow under the seam an to the crystal.  This will help distribute the heat and allow retrofit to an existing crystal, which is what I did later when adding temperature control to my TS-440.  Four wires are required to connect to the control circuitry and should be as small as feasible so as not to conduct heat away from the crystal.  Figure 5 shows how I glued the LM-34 and heater resistors to the copper sleeve using cyanoacrylate "SuperGlue".

         .Figure 4.  Copper Sleeve for Crystal                                           


   Figure 5.  LM-34 and Heater Resistors Glued to Copper Sleeve                               

Figure 6 shows how it all comes together with the main components of the temperature controller located a short distance from the copper sleeve containing the LM-34 sensor and 30 Ohm heater resistors.  As a final touch I whittled out a small cube of Styrofoam to fit snugly around the crystal assembly to minimize heating requirements and provide some isolation from the other heat-generating parts of the rig.
   Figure 6.  My 30m MEPT showing how the crystal heater is connected to the control circuitry.         

Mike, N0QBH emailed me asking for info about my temperature controller and I sent him much of the above data.  Figure 7 shows the really neat way he incorporated it in his QRP Labs MEPT .  Figure 8 is a close up of the crystal assembly.  Placing the components on the short crystals is more difficult that on the larger ones.  Note that there is a copper jacket around the little crystal.  There are more details at Mikes WebPage.

 Figure 6.  N0QBH's version of my temperature controller


Figure 7.  Close up view of components mounted on crystal

I have recently tried a new temperature control circuit which has only 4 parts, ALL mounted on the crystal.  I use in on my 80m QRP Labs rig and so far it works about as well as the one I just described.  But I'm tired of typing tonight and will add a description of it to this post at a later time.  I will also tell you how I added a temperature controller to my TS-440.

de w4hbk


Wednesday, March 9, 2011

A new toy

I have experimented off and on with the "Watch Window" feature in Spectrum Lab which lets you plot a graph of signal intensity vs time.  Up to 10 signals can be view at once and plotted on the same graph in different colors.  Each signal is selected from the Waterfall Display by setting the lower and upper frequency.  For a square wave type QRSS signal this is just below and above the Mark and Space frequencies.

While I was doing this, Dave (WA5DJJ) was developing a way to compare antennas by having two stations transmit on the antennas using the same power level, 100mW in this case.  We had not been coordinating our efforts in any way but when I heard from Dave about his experiment  it occurred to me that the WW feature might allow us to view the relative signal strengths directly.  So, with both of the signals bracketed I began recording and here is my first image:

Figure 1 - Plot of Signal Strengths from WA5DJJ and KE5OFK


Both stations are located in the same neighborhood in Las Cruces, NM and I am 1164 mi/1873 km to the west.  OFK was using an inverted V,  DJJ a Butternut HF6V vertical and my receiving antenna was an inverted V broadside to them..

First thing I noticed is the slow QSB....then how the two stations fade 180 degrees out of phase. The inv V has the edge on peaks by several dB but much deeper fades.

                     Figure 2 - Same parameters as in Fig 1 but Nine hours later

The next image was taken about 9 hours later, near my sunrise.  Notice now that the two stations are now fading together and that the inv V is better than the vertical by about 7 dB.  I've seen this kind of signal strength differences on the Las Cruces stations before but could only judge which was stronger by the brightness of the traces.  Window Watch puts this into numbers though I haven't used it enough to have confidence I'm doing everything correctly....more testing and experimenting is needed.

Not only does this technique provide information about the antennas but also about the Ionosphere, but this is where things get really complicated because of all the phenomena which effect the amplitude and phase of a radio wave passing thru the Ionosphere.  With more observations and lots of reading maybe some of this will become apparent.  Your comments would be welcomed.  But for now I'm just showing some pretty pictures :>)

One final note....I cannot disable the AGC on my rx and I think this is why the Noise trace is fluctuating as strong signals cause pumping.  You can also see this on VK6JY's signal and it may be possible to correct for AGC effect by just subtracting off the noise level.

73 bill w4hbk

Monday, February 28, 2011

Image Stitching


I really like long term grabs as a way to see how the band is doing over time. I utilize simultaneous instances of Spectrum Lab, one a ten minute span useful for ID'ing calls and the other a five hour span which has several advantages. It has a much better noise performance due to the averaging feature in SL which improves SNR by the square root of the ratio of averaging times, 5.5x in this case. This is readily seen in my 5hr grabs where signals not visible at all on the regular 10min one show up as easily noticed traces.

I've also found that for long-term images made by stitching together a number of shorter images the SNR also improves by what seems to be the same as above. That is true for QRSS Stitcher from VD Labs. I should add, not just stitched but also "squished" to screen size. The squishing process also averages the pixels in a way to improve the SNR.

How to Stitch

Download QRSS Stitcher and watch Scott's video on how to use it, on the download page. Next you will need a folder of images to be stitched. Do this with your own grabber or by capturing images from one of the online grabbers using SiteShoter which I described on a previous post. Run Stitcher and follow the prompts, making sure you select "Create a squished image too" and enter the number of images in"Squish to" box....then "Stitch". The results will be deposited in a sub folder named "Stitched". I usually have to lighten the squished image a bit. Otherwise that's all there is to it.

You can see in the above images how closely the stitched-squished image looks like the 5 hr grab.

73 bill w4hbk

http://www.qsl.net/w4hbk/W4HBKgrabber.html

Thursday, February 24, 2011

Grabber Image Capture


I am using a program called SiteShoter to capture images from the various grabbers and collect them in a folder according to date and time. This allows me to watch for my MEPT at any of the usual on-line grabbers while away from the shack and then browse though them later to see how I did. You can even run several instances to record more than one grabber at a time. Last night, for example, I recorded the images being displayed at the EA1FAQ, VK7ZL and ZL2IK grabbers and then browsed them while enjoying my morning coffee. In addition it is easy to combine the images with QRSS Stitcher and make a long, compressed image like I record with my 5 hr grabber or do other processing.

Here's how it works:

1. Create a folder in which to place the images before running the program.

2. Enter the URL of the image at the grabber site. Obtain this by right-clicking on the image then selecting "Copy Image Location" and then pasting into the top box "Single URL/file".

ex. http://www.on5ex.be/grabber/capt.jpg for the image at the ON5EX grabber

3. Enter the path name to the save folder in the "File name" box. The file name is made from the desired date and time format you choose as explained in the documentation.

ex. C:\Documents and Settings\Desktop\SL3\%date:ddMMMyy%-%time:HHmm%.jpg

4. Enter the screenshot interval in the last box at the bottom. e.g., if the grabber's screen is 10 minutes wide enter 10 minutes.

The documentation is a bit skimpy on the other parameters so I ignored them except for the image size....a little trial and error will get what you want.

To make multiple recordings just run SiteShoter again and add the parameters for the other folder and image location.

73 bill w4hbk